How do I track my investment activity with Google Analytics?
Google Analytics is a very powerful tool that allows you to view everything from the age range of your campaign viewers, to what buttons they have clicked on your page, to the type of browser they are using. While gathering data on the investment activity on your campaign page is an important part of evaluating your marketing efforts, it means nothing if you can't find where that data is.
StartEngine makes it easy to integrate your own company Google Analytics account, into your StartEngine Campaign page. Simply by adding your Google Analytics ID (click here to learn how to find your google analytics ID) to the "Basics" tab of your campaign page (or "Campaign Options" for companies who are already live), we add a tracking pixel directly onto each companies campaign page.
The main events that we track automatically are as follows:
- Pageview (user has viewed your campaign page)
- Play Video (user has clicked the play button on your main campaign page video)
- Follow (user has clicked the "Heart" button on your campaign page)
- Invest Now (user has clicked the green "Invest Now" button of your campaign page)
- Declared Amount (user has entered in a dollar amount he/she would like to invest)
- Add to Cart (user has become an "incomplete investor" to receive any updates in the future)*
- Purchase (Successfully submitted an investment)
* "Add to Cart" is triggered anytime someone enters in an amount on the Invest Now page. This means that one visitor could trigger the "Add to Cart" event multiple times.
Now that you know what events are being tracked automatically, see the below instructions to view the investment activity on your campaign page:
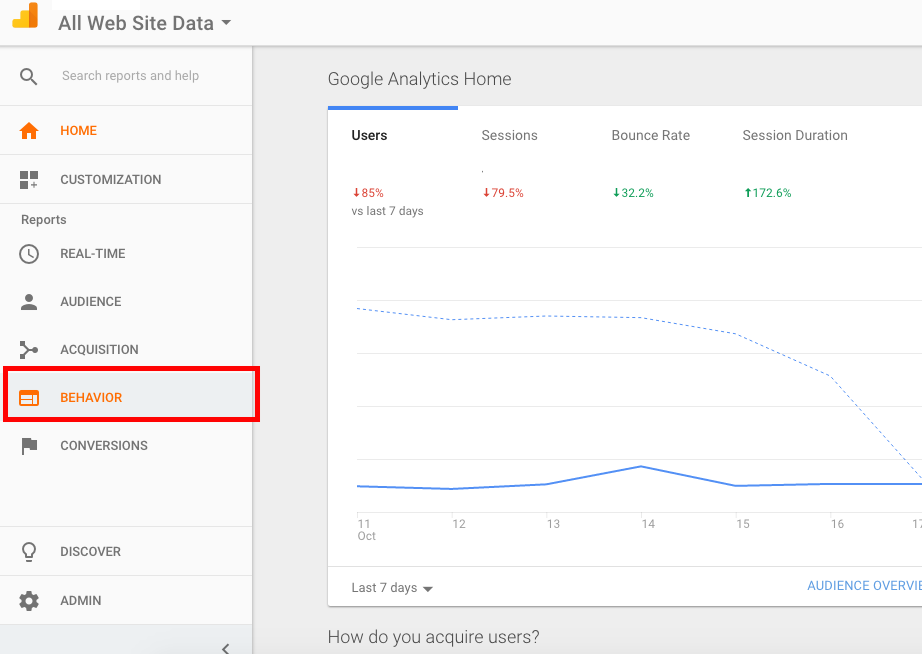
- Login to your company Google Analytics account
- Click Behavior
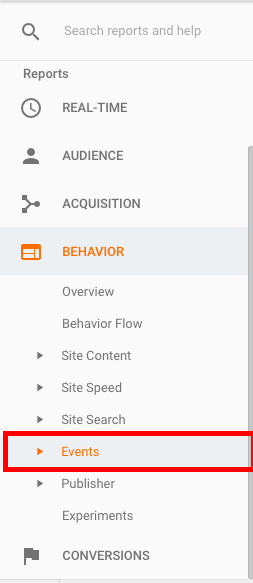
- Click Events in the dropdown
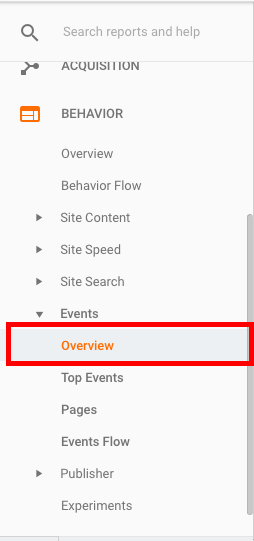
- Click Overview
- Update Date Range
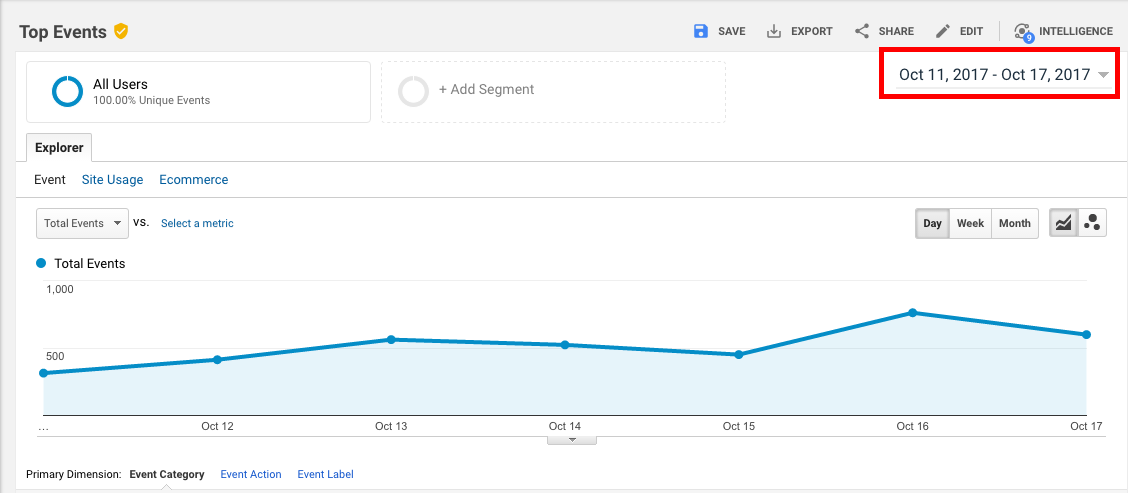
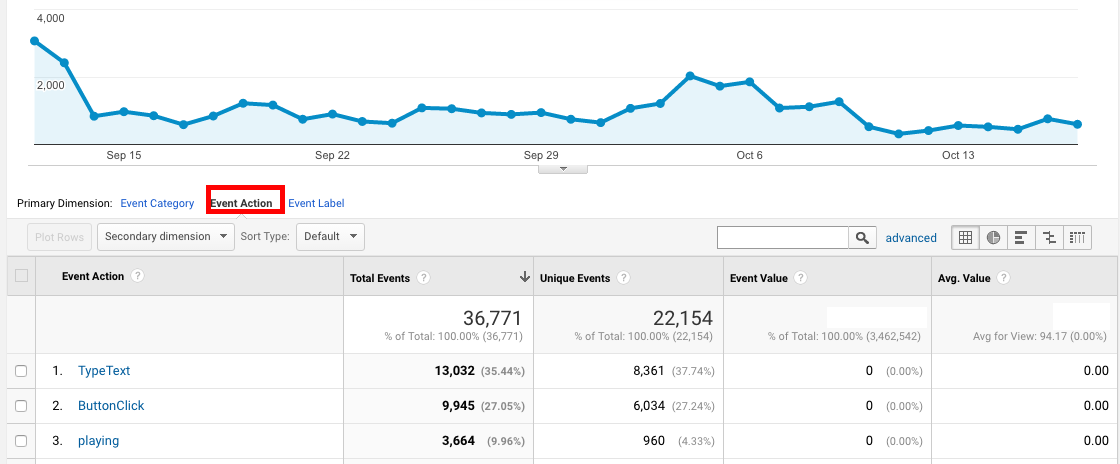
- Click Event Action
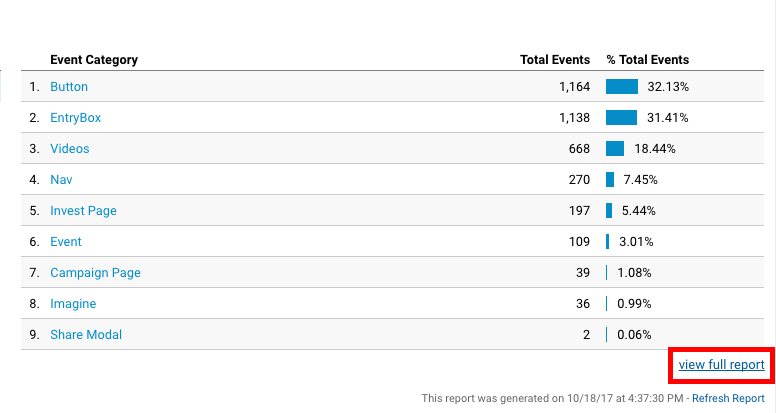
- Click View Full Report
- View the results!
By scrolling through the "full report" you will be able to figure out the number of people who have taken whether it's viewing your page, clicking the "Invest Now" button or actually committing an investment ("Purchase").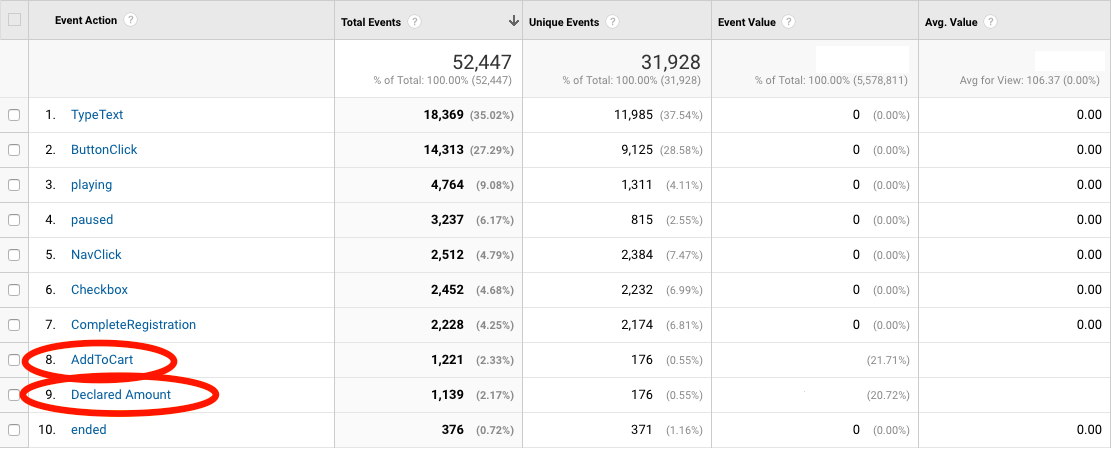
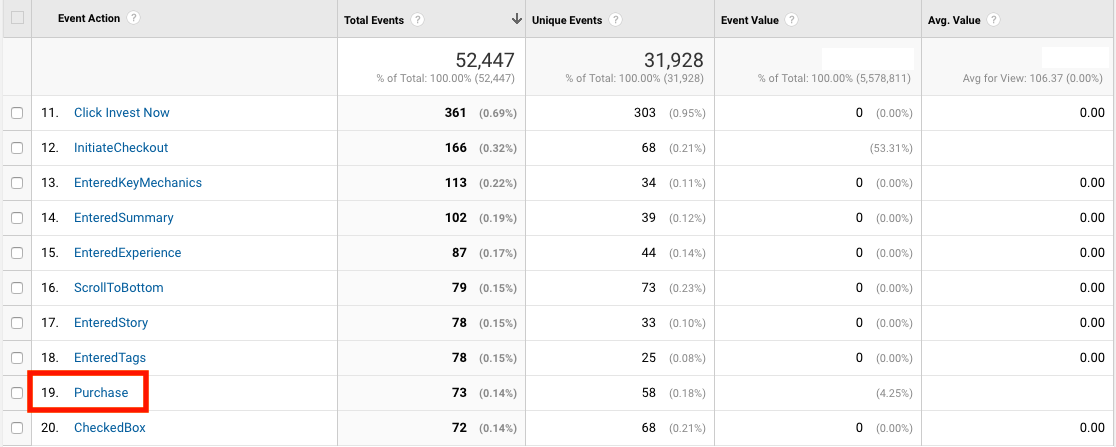
Please note, the "Purchase" event might not be on the first page as it is a more rare event, and thus will likely not be clicked as frequently as others.